Using tech to untangle complexity in impact evaluations
| 16 October 2017 | Latest QuIP News
The impact evaluation world is always looking for improved ways of managing data, with many temptations out there in the form of sentient learning and clever algorithms. At BSDR we have embraced technology as an enabler throughout our QuIP journey, but with the caveat that it should always help us highlight complexity, not hide it away behind averages.
In an effort to help us deliver this in a relatively simple way we have invested in bespoke solutions in Excel which help analysts to pull out complex data for report writing. However, we would love to see evaluations being used and understood by more than just the monitoring, evaluation and learning teams who are used to wading through impact reports. The detailed findings from our deep-dive studies are of potentially great use to frontline staff, and where time and budget allows we encourage ‘triangulation’ workshops with project staff at the end of a QuIP study to work though findings and their implications for future work. However, where this isn’t possible and time pressures mean that long reports may be left unread internally, how can we make the data more accessible to a wider group of users?
QuIP is an approach that puts intended beneficiaries’ voices at the centre of evaluations so it is critical that any presentation of qualitative information does not lose the ability to see and trace back to that voice. So far Excel has served us well, enabling us to find relatively simple and flexible ways to code, analyse and present qualitative data in a meaningful way.
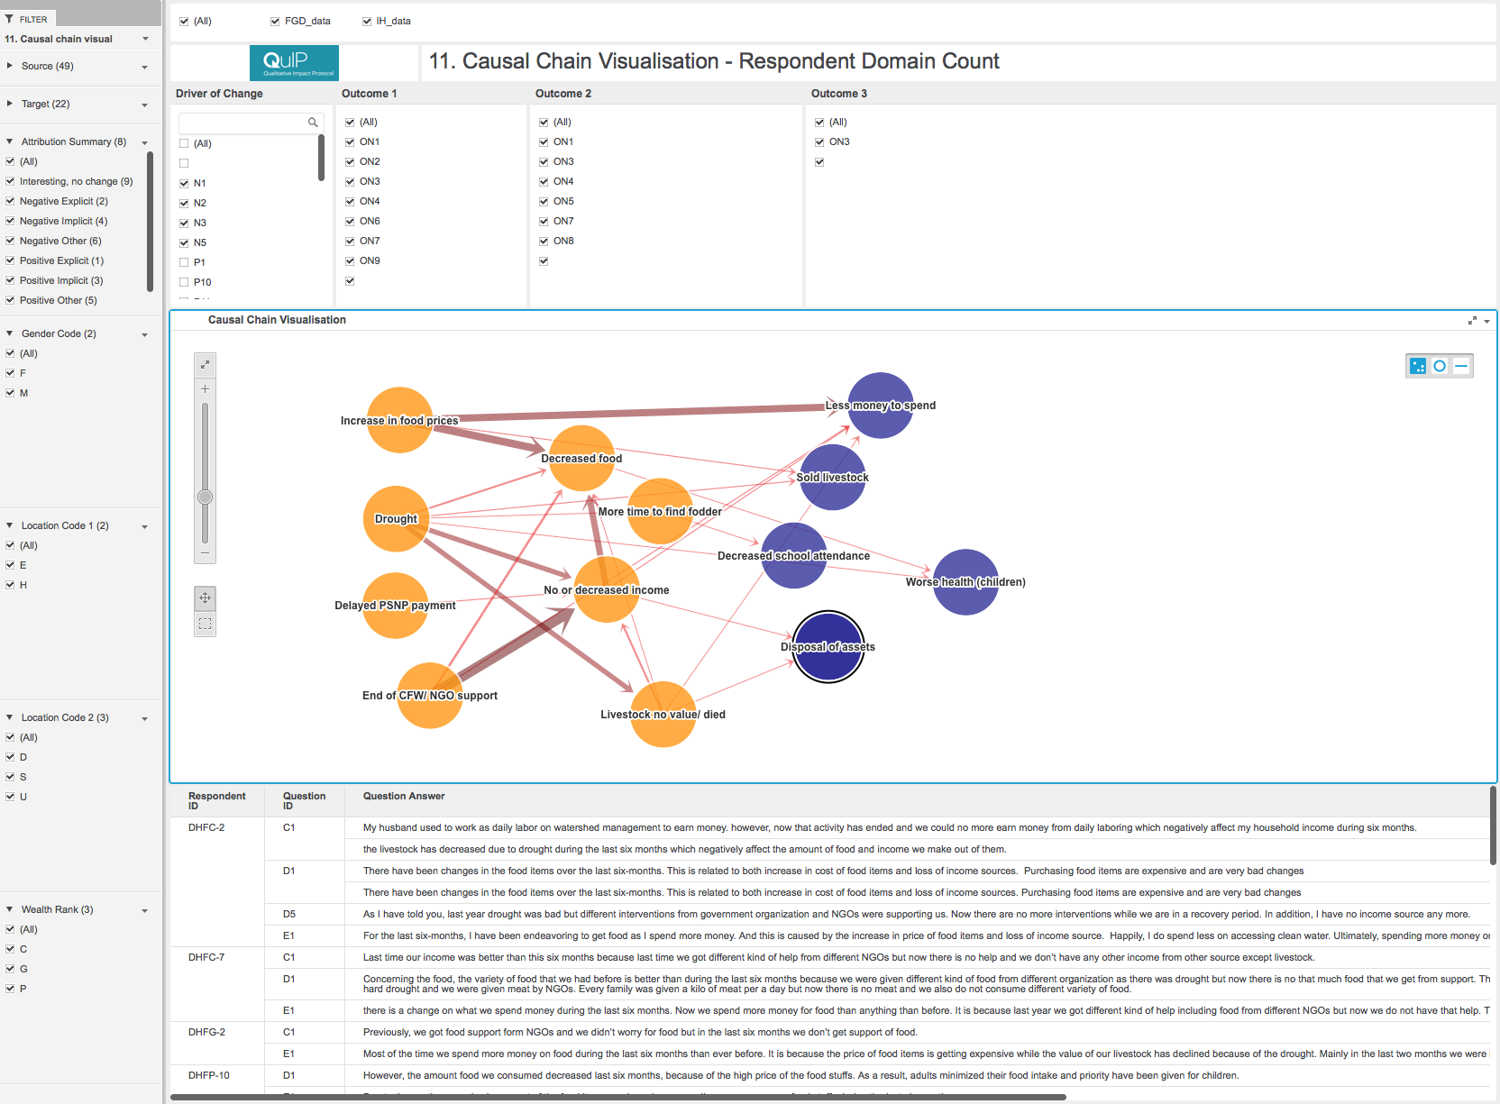
However, as we have developed our approach to coding causal chains, we have started to look for more tools to help visualise the changes occurring in people’s lives, and the extent to which these changes are attributable to interventions or other factors.
Maintaining the richness and complexity of the data in a manageable way presents a challenge; where could we look for help? We started to explore how the private sector use business intelligence (BI) platforms to manipulate, interrogate and present data to glean business insights and adapt strategy accordingly. The corporate world is racing ahead in this respect and complex analysis of data is critical to so much business, from retail to banking.
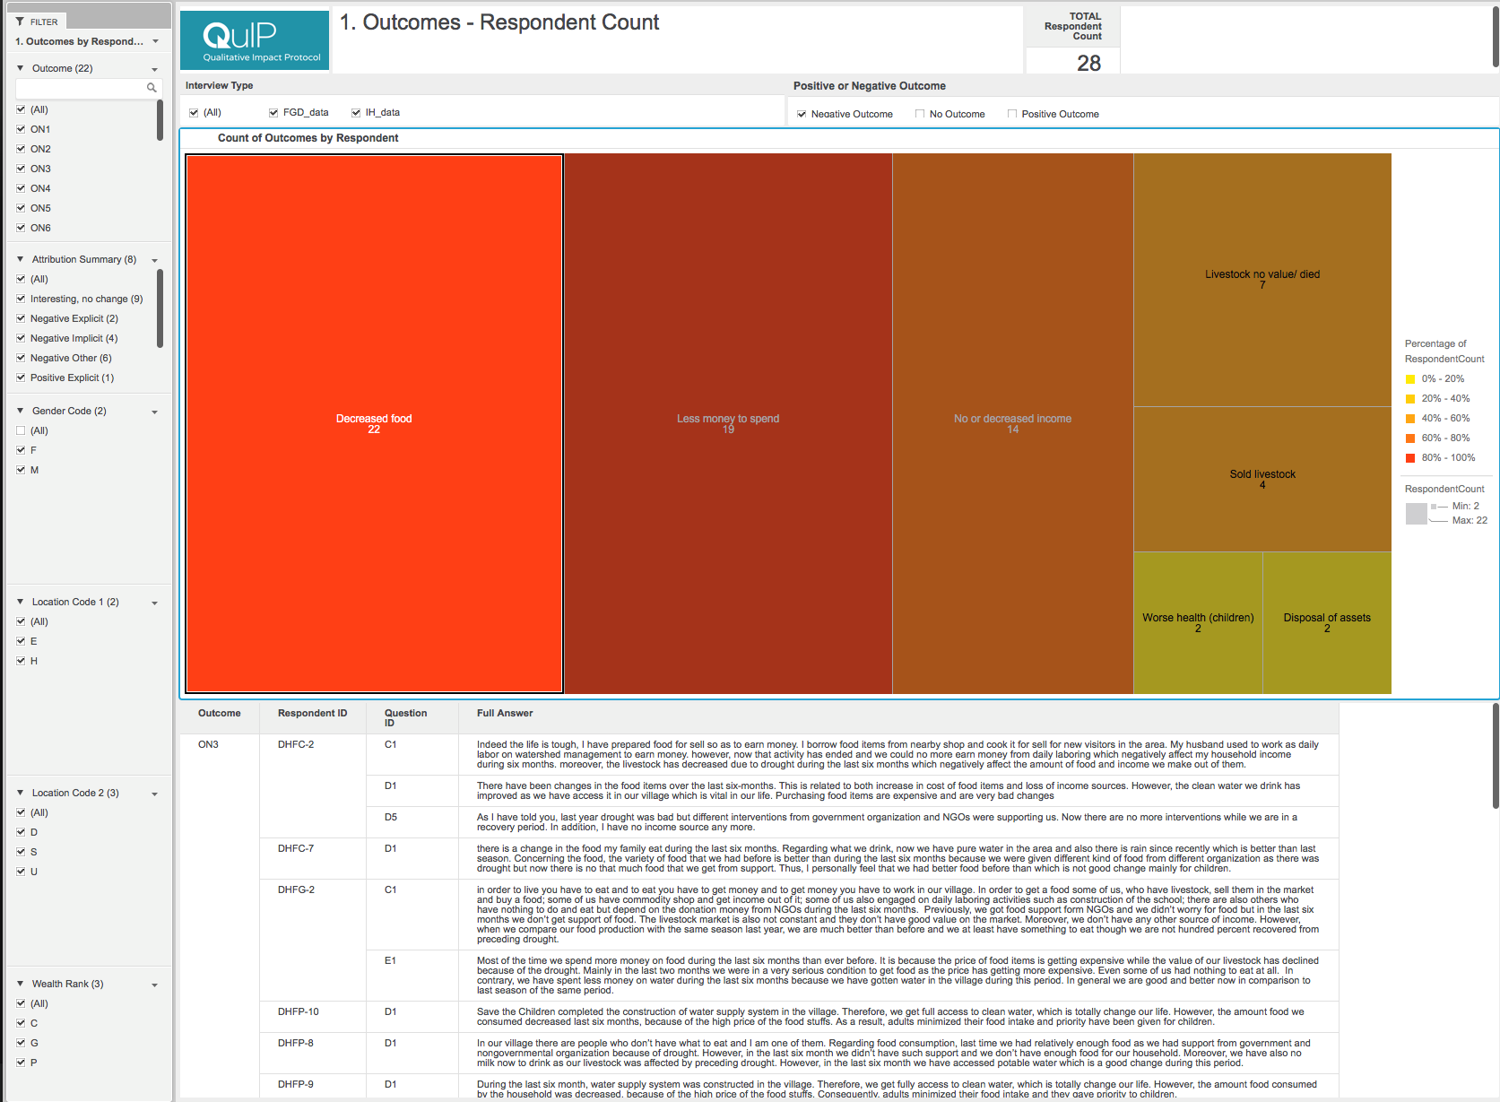
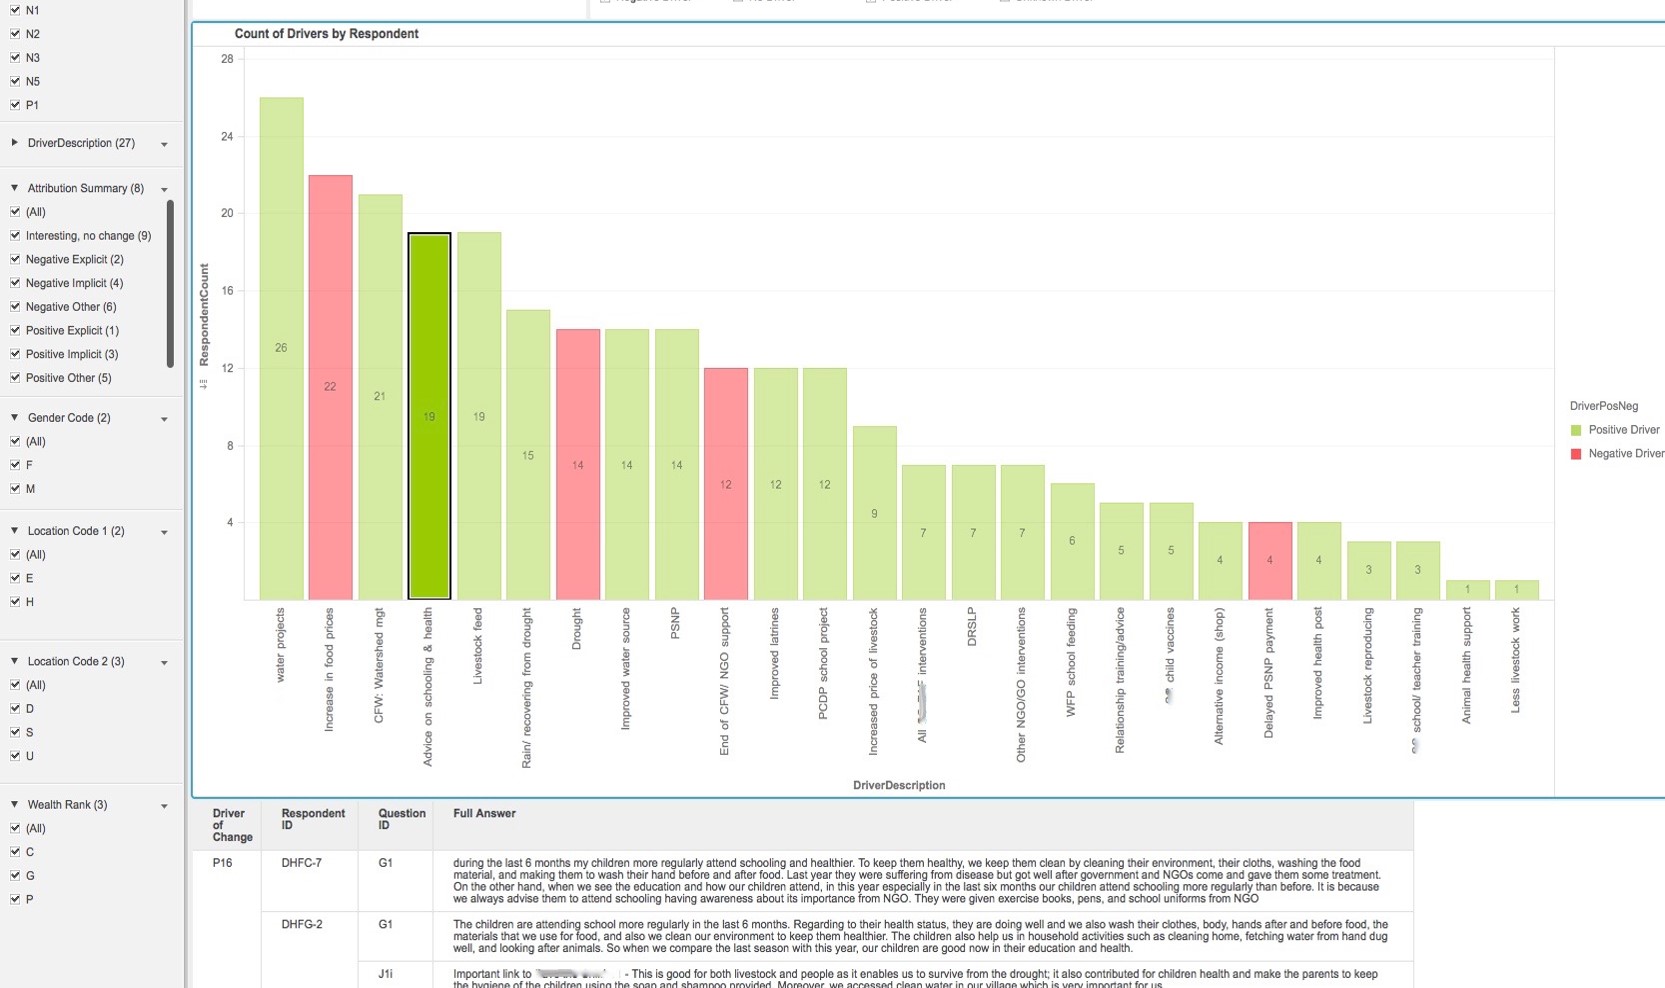
Through our involvement with Tech4Good Bristol, we started conversations with KETL, a data warehousing and analytics company to see if the world of BI could help. Building on the raw data in our own Excel coding solution, KETL have helped us to develop a more intuitive and interactive interface within a BI platform called Microstrategy. This new dashboard will allow MEL teams, project staff and even donors to easily interrogate and visualise the complex picture of changes happening in people’s lives, without losing respondents’ voices – still very present in the dashboard.
This is an exciting development for BSDR and we look forward to working with clients who wish to move beyond the standard report and engage more closely with the source data. Contact us if you’d like to find out more!
Example dashboard screenshots:


Comments are closed here.