Causal Map update #3!
| 5 December 2023 | News
For anyone who has followed our journey into the world of qualitative data analysis software, we’re pleased to announce a sleek, new and improved version! Causal Map version 3 (CM3) has launched and is already being used regularly by a team of early adopters and new users. The update has a much cleaner look, is more intuitive to use, and (most importantly) is a lot faster due to a complete engine overhaul under the bonnet (think combustion engine to EV). It’s beta and not yet completely perfect, but it’s a very exciting and positive step forward.
Change does mean learning how to use a slightly different interface, particularly when it comes to analysis of coded data. However, having been through this transition myself, I can tell you that the learning curve is small and well worth the time. You will easily save that time two or three times over within a project, and never look back! CM2 is still live and being supported, but will gradually be phased out. All new subscriptions will be on CM3, but you can easily import any existing data you have from a CM2 project, and your subscription is valid on both platforms.
Key new features which I have particularly enjoyed when coding QuIP data include:
- When coding you now see all statements from one interview together, and the causal map for that interview appears instantly as you code. This makes it much easier to ensure coding consistency within an interview.
- It is much faster and easier to jump to a specific source (e.g. person!) or question, or to switch between viewing a single source map or an aggregated map. This makes it easier to settle on a coding framework in the early stages of qualitative data analysis when you are considering new causal links and how to use existing factor labels most appropriately.
- Managing links, including changing factor labels, is even easier than before – including being able to view and check the statements behind existing links before making any changes.
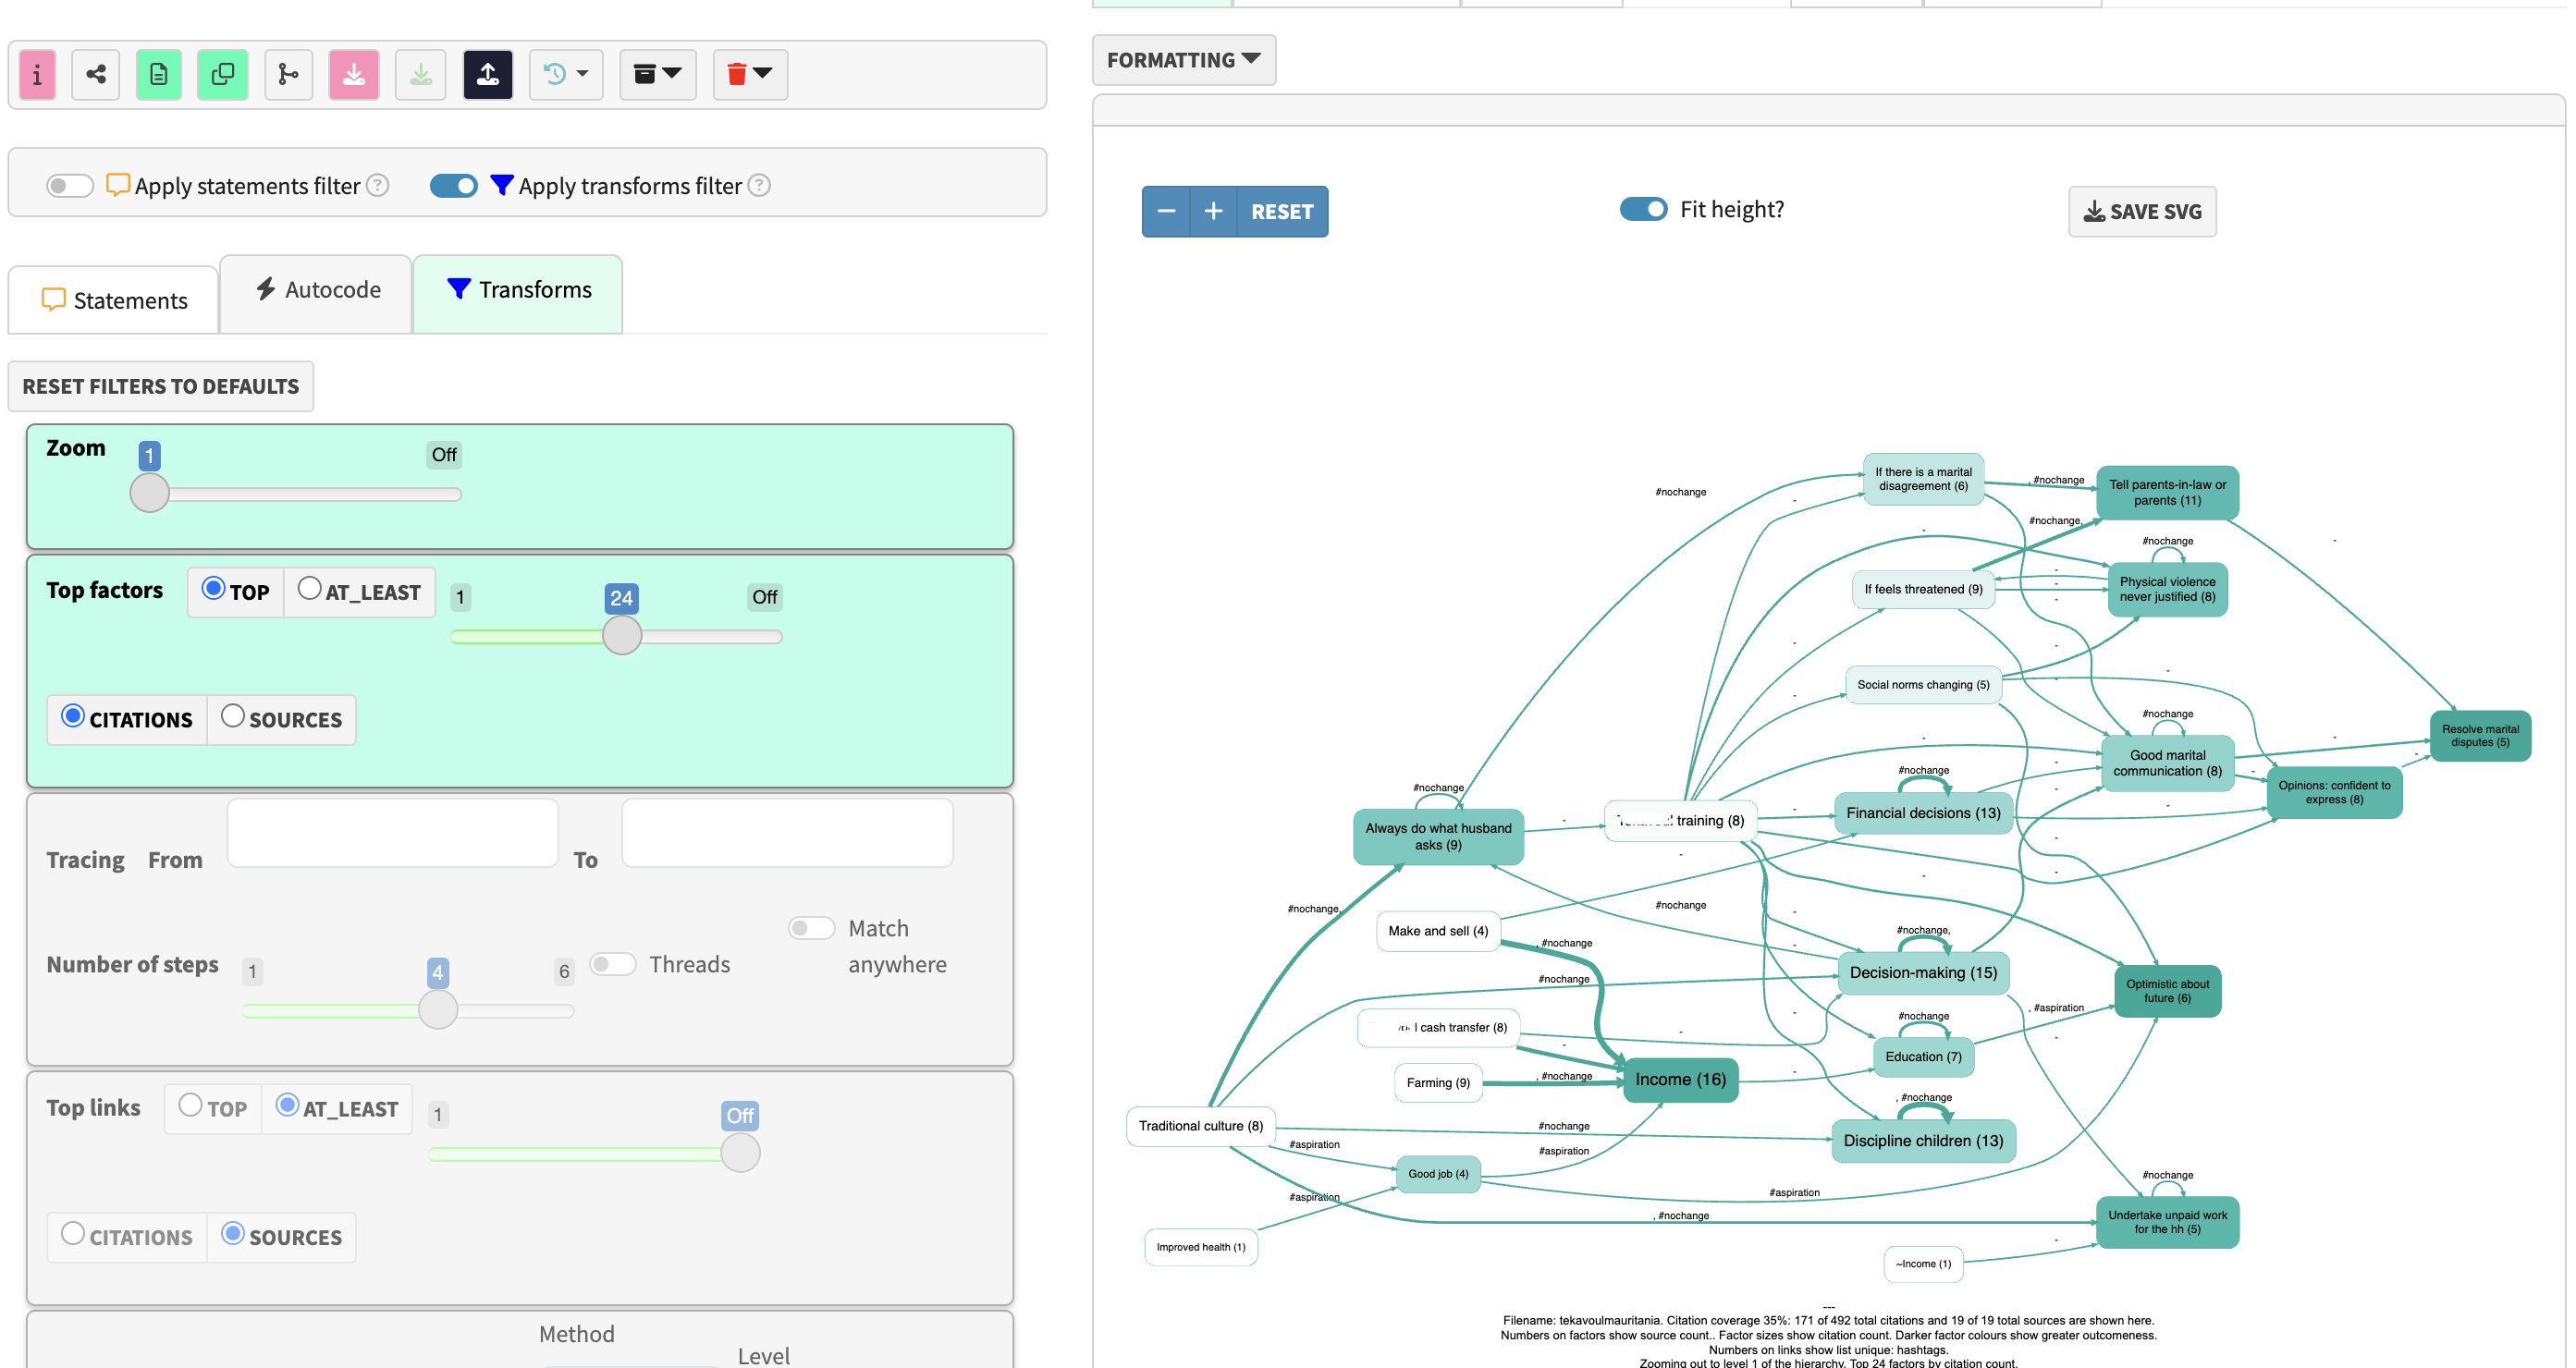
- The maps are cleaner and with a better layout. Formatting options to alter the maps are easy to use.
- Filtering your data for analysis is more straightforward, with a range of default options built in via sliders rather than you typing any commands out.
- You can still save and share links to specific filtered maps or tables with anyone else who you add to the file, or download high quality svg files to insert into a report.
New users may also notice this new tab in the middle – Autocode… a sign of things to come?
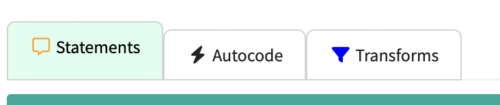
This feature is not yet available to users, but behind the scenes Causal Map is doing some very interesting work on the potential of using generative AI to speed up causal coding. CM3 is designed to be AI-ready, but this feature won’t be rolled out to unsupported users until much more testing and refining has been carried out on the user interface. Contact hello@causalmap.app if you are interested in using this feature with support, or if you want the Causal Map team to auto-code your data for you – especially interesting if you have a lot of data.
The Causal Map team is on hand to support anyone transitioning between the two versions. You can can access a revised guide here, and for any more specific queries or to be added to the Slack support channel for active users, please contact Causal Map’s Outreach coordinator, Gabi at gabi@causalmap.app.


Comments are closed here.