Causal mapping local progress towards the SDGs; Bath & North East Somerset
| 5 October 2023 | News
Recent news has rung alarm bells about how far away the world is from meeting the 17 Sustainable Development Goals set by the UN; documenting what is and isn’t helping us move in the right direction has never been more important. Speeches and campaigns tend to grab headlines, but what is really going on at the grassroots level? In 2018 New York City pioneered a “Voluntary Local Review” (VLR) of the UN Sustainable Development Goals (SDGs), and since then more than 60 local authorities worldwide have compiled a VLR to assess local progress towards the SDGs. The formidable task of doing this for our own local authority, Bath & North East Somerset (B&NES) was undertaken by a Centre for Development Studies (CDS) placement student, Charlotte Matthews, at the University of Bath earlier this year, relying on a range of open source data to track progress towards each goal. Once the initial research was complete, supervisor Aurelie Charles contacted us to find out if we could add some causal maps to the report to help visualise the links between local initiatives, local actors and SDG outcomes. This task was carried out by another CDS placement student working at Bath SDR, Will Airey, who used the data in the report to add a causal map for each SDG. We’re delighted to share the report which has been published by CDS.
Local authorities have historically struggled to identify priorities, opportunities and points of leverage which would trigger positive change, within and across the SDGs. Mapping these links is a way to help make potential leverage points and key stakeholders involved in those areas easier to identify. This approach is quite different to how we at Bath SDR usually use Causal Map – Charlotte and Will used documentary evidence rather than first hand QuIP interviews to map links, but it is an approach that Steve Powell at Causal Map Ltd has been putting to very good use this year across a number of larger projects. With the assistance of AI hundreds of documents can be analysed in a similar way, automatically identifying causal links in text. However, for this project we relied very much on the human brains and tenacity of Charlotte and Will!
The maps in this report only reflect the evidence available, and in this case we opted to only map evidence of work which had been completed – not activities which were planned for the future. Charlotte reviewed a large number of council documents on different topic areas which contained relevant overlapping information and snowballed from there to assess the commitments of businesses working within the region. However, she acknowledged ‘Sometimes these [statistics] were inaccurate or contradictory across documents, and often exact achievements were not included (or followed up on), only the initial document stating the desires of the business / council. This made reviewing the actual improvements rather difficult. I relied on the Office for National Statistics for many of my statistics as a result, but this makes ward-by-ward analysis near impossible.’
We hope that the report provides a flavour of what activities in the B&NES area are attempting to contribute to progress towards the SDG, and we would love to be able to update it year on year!
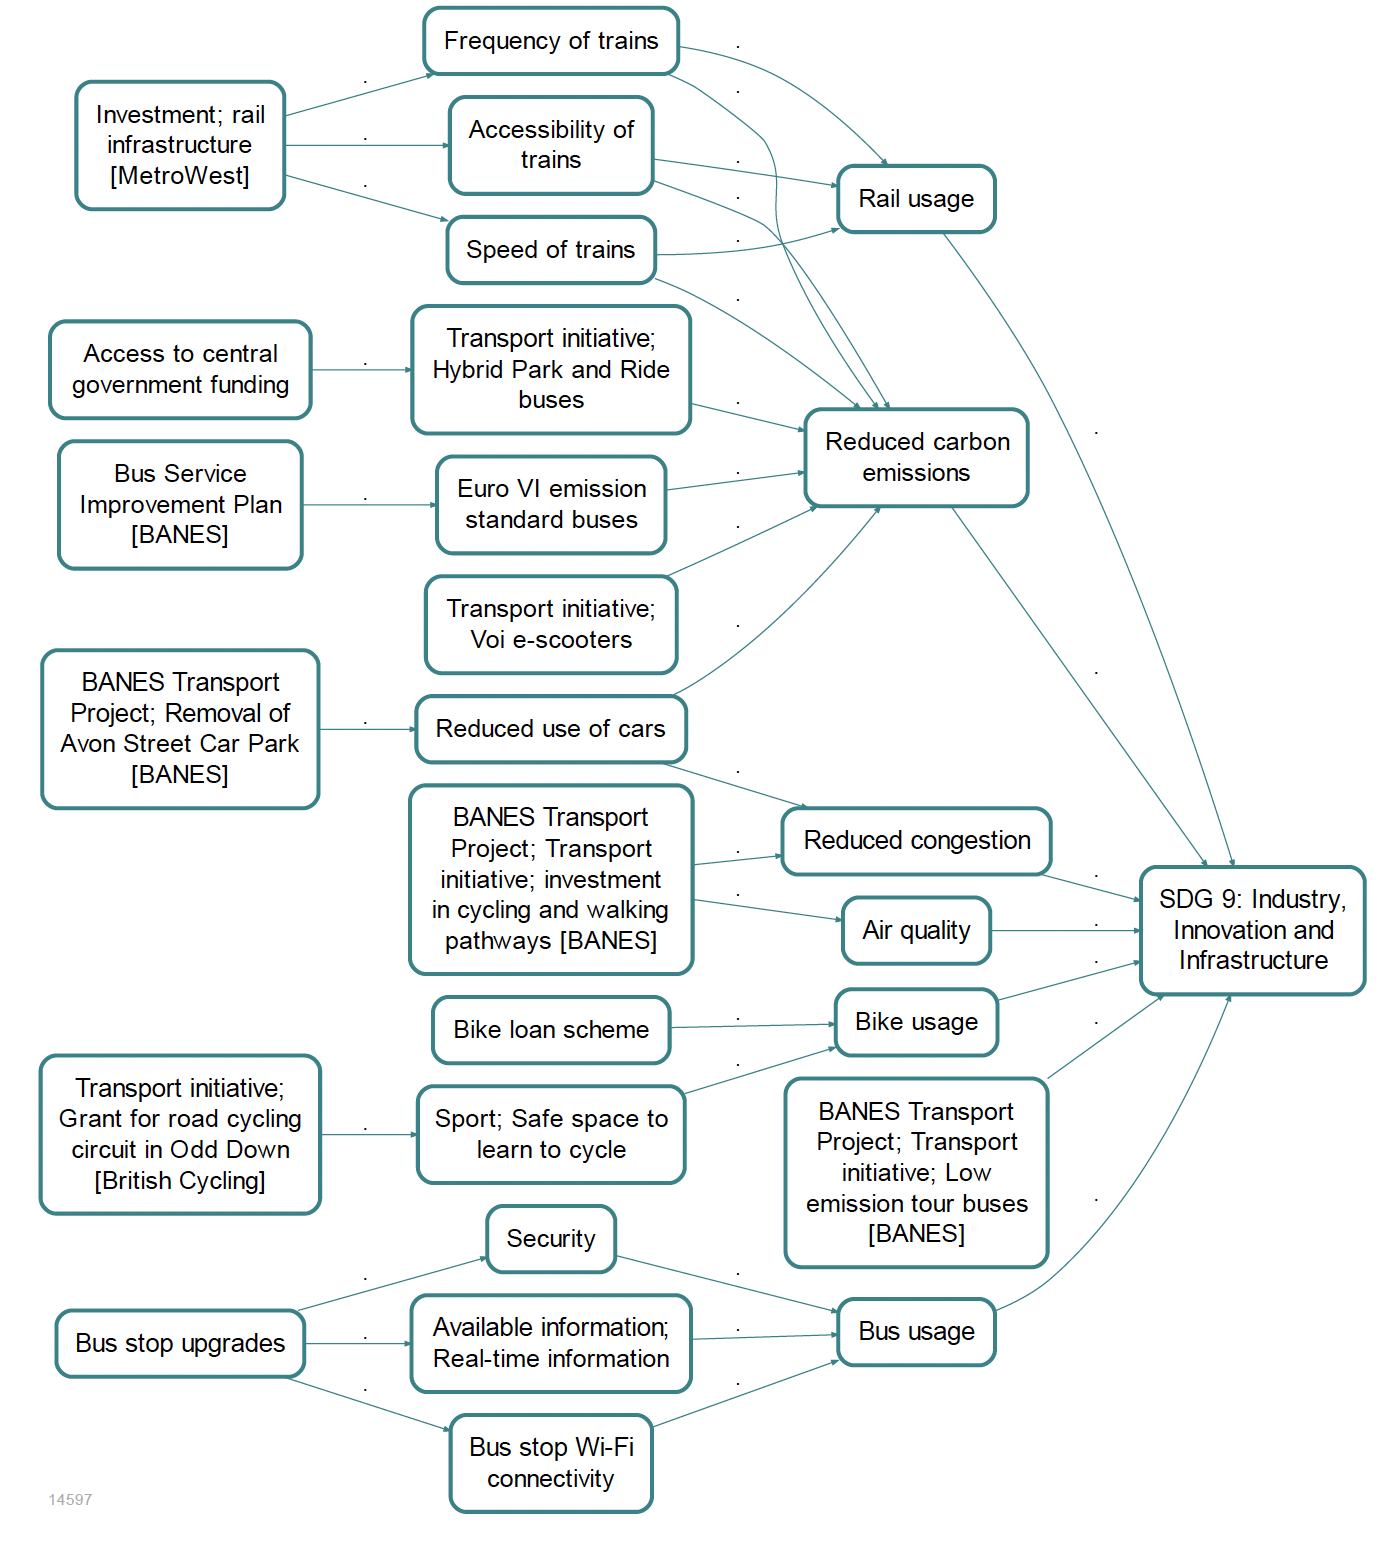
The map reproduced here shows progress made towards building resilient transport infrastructure, part of SDG 9.


Comments are closed here.