QuIP has developed a particular approach to analysing narrative data to identify causal mechanisms or claims, connecting cause and effect with links. Coded links are made up of an influence factor and a consequence factor, rather than simply coding sections with isolated factors. This is a form of causal mapping which can be done manually using software such as Excel. We have invested in the creation of the Causal Map App, bespoke qualitative data analysis software which speeds up the coding process and enables users to visualise the data in the form of causal maps, aggregate and filter hundreds or thousands of causal links across a dataset.
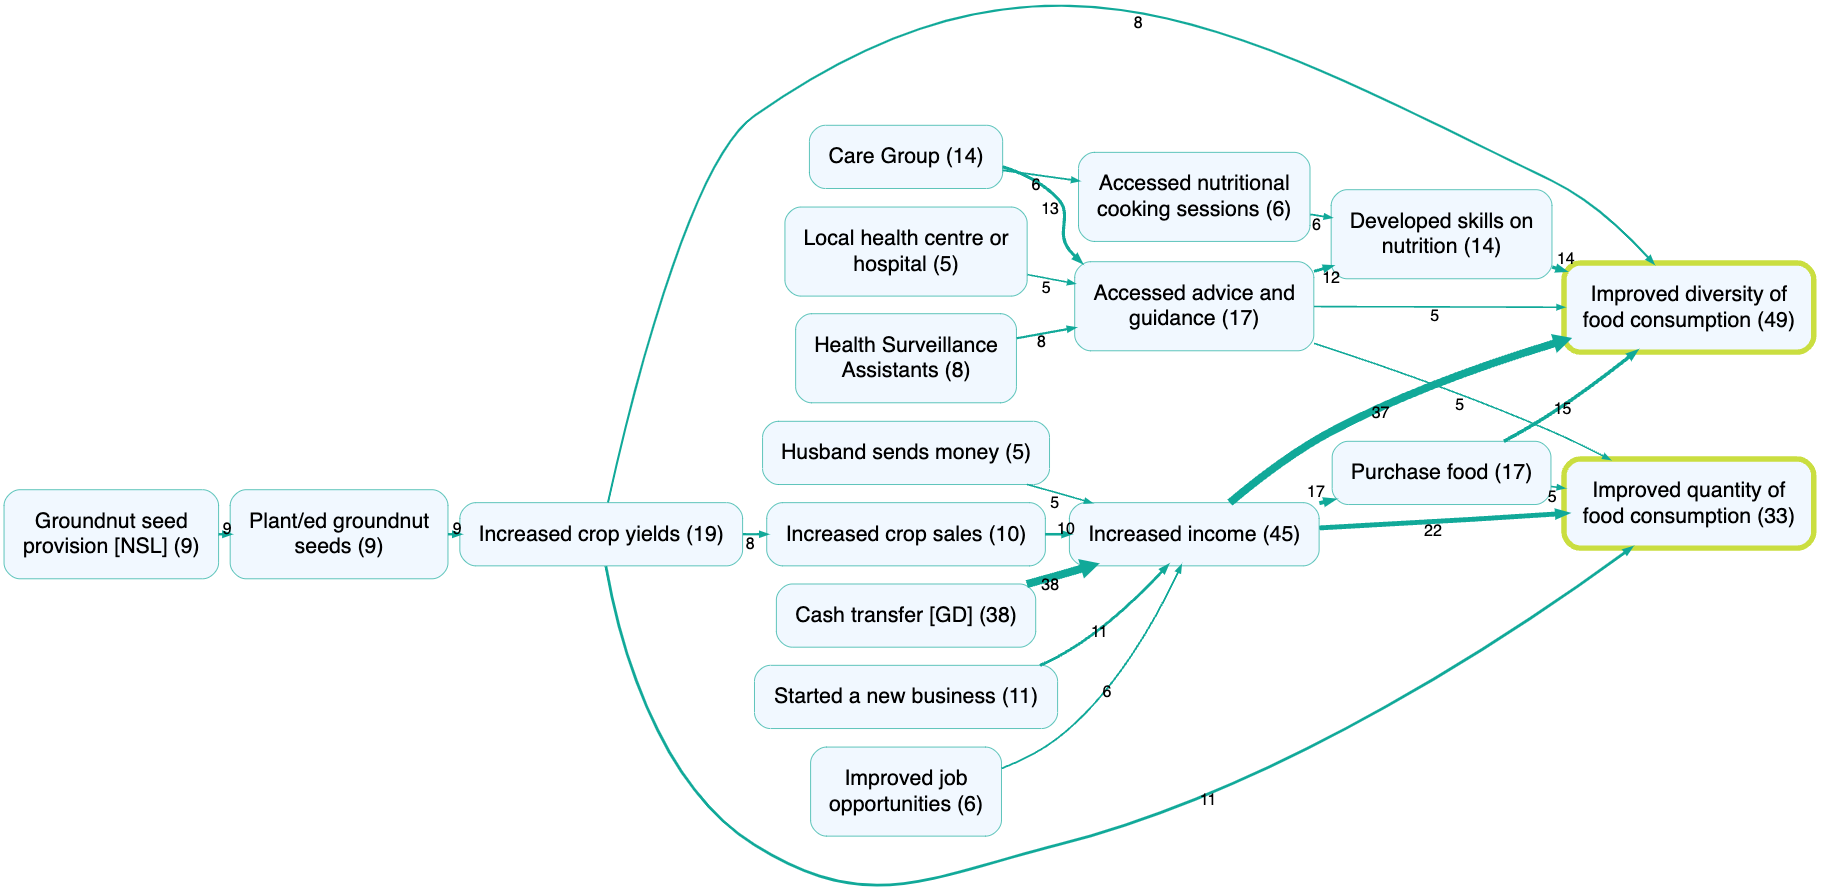
A global causal map resulting from a research project can contain a large number of links and causal factors. By applying filters and other algorithms, a causal map can be queried in different ways to answer different questions, for example to simplify it, to trace specific causal paths, to identify significantly different sub-maps for different groups of sources, etc. Sub-maps can be analysed to understand the relative strengths of the main stories of change generated from interview transcripts, and to answer the main research questions. There are ways of tagging and flagging the links to make it easier to filter for stories which are relevant to attribution questions at the analysis stage. In the example below, the map has been filtered to search for all drivers of improved nutrition. The numbers refer to the number of people who made that link or cited that factor.
Respondents’ voices remain at the centre of this process, the statements behind each link are easily accessible and often used in reporting – opening the black box of data analysis which often sits in between transcripts and reporting. We have written a guide to creating and using causal maps in evaluation called From narrative text to causal maps: QuIP analysis and visualisation.
You can find out a lot more about questions you can answer with causal mapping in this document, and read more about the theory and history of causal mapping in this journal article.
Click here to go to the next page on QuIP and other approaches

