Enhancing our impact assessment: Dorcas’ journey
| 21 November 2023 | News
Thank you to Gerben Visser, Mary Dhliwayo and Shammah Kiputu for this guest post. Gerben Visser is a Monitoring, Evaluation and Learning (MEAL) advisor at Dorcas. Dorcas MEAL officers Mary Dhliwayo and Shammah Kiputu work in Mozambique and Tanzania respectively. These individuals were the first of many Dorcas team members to undertake QuIP training as the organisation has embraced it as a regular part of their M&E work. Dorcas is a Dutch NGO which works with partner organisations around the world to deliver tailor-made humanitarian programmes.
Dorcas embarked on a transformative journey in 2019 when we discovered the Qualitative Impact Protocol (QuIP). We were looking for an affordable and robust method to measure the outcomes of our programs and uncover the underlying causal factors, and ventured into the realm of QuIP driven by the desire to enhance our impact assessment efforts. In this blog post, we share our experiences and insights gained from adopting this powerful methodology in the context of our NGO work.
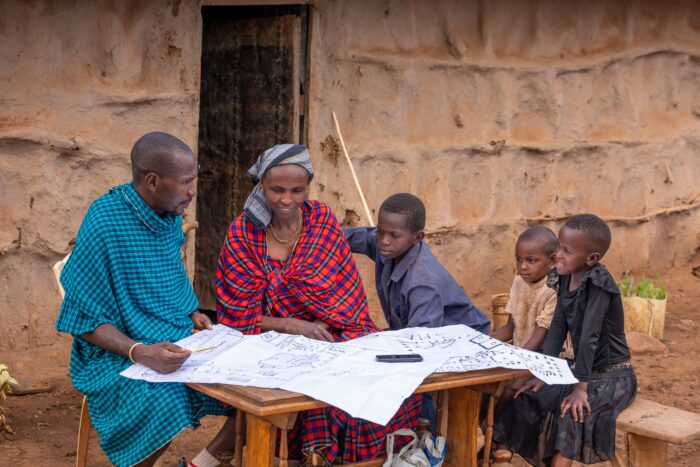 Photo from Dorcas’ Integrated Farm Planning project
Our journey with QuIP began with thorough research, guided by the principles of evidence-based decision-making. We searched for innovative methodologies, including the Better Evaluation website and the Peregrine Discussion Group (hosted by EvalPartners), we learned about the potential of QuIP for our organisation. We were particularly encouraged by the endorsement of the NGO Tearfund which has successfully employed QuIP for program evaluations on multiple occasions [see here for more].
Our experience with QuIP
Bath SDR helped us organise an initial training session in Egypt. This training was conducted just before the outbreak of the COVID-19 pandemic in February 2020, causing a temporary delay in our plans for evaluating Dorcas’ Farmer Field School project in Egypt. Despite the challenges posed by the pandemic, we successfully conducted QuIP interviews in Egypt in 2021.
Building on this experience, we conducted a subsequent study in Kenya in February 2022 to evaluate Dorcas’ Makueni Dairy and Milk Value Chain project. In June 2023, we expanded our QuIP journey to Tanzania and Mozambique to assess the impact of Dorcas’ Integrated Farm Planning project. In each instance, we ensured that our data collectors were adequately trained, and we meticulously piloted the questionnaires developed during the training.
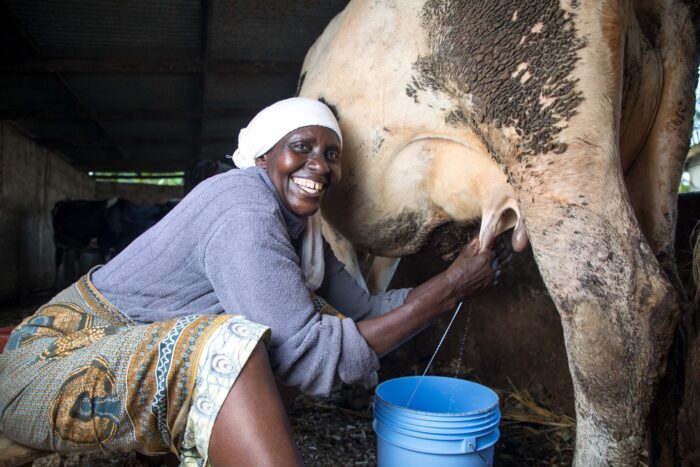 Photo from Dorcas’ Integrated Farm Planning project
Key learnings
The QuIP methodology has proven invaluable to Dorcas, providing profound insights into project outcomes and the underlying causal factors, which can either be a result of our own project or program efforts or external. It’s helped us be in a better position to claim a contribution to certain project or program outcomes. It also serves as a vital tool to validate our theory of change and adapt our strategies as needed. Combining QuIP with quantitative surveys has allowed us to strengthen our findings and enhance the rigour of our evaluations.
While QuIP is generally straightforward to apply, we encountered unique challenges in different contexts. In Egypt, the application of blindfolding was limited due to cultural considerations, and we were unable to fully blindfold researchers in Tanzania and Mozambique. In Kenya and Mozambique, data quality fell short of our expectations. This highlighted the importance of follow-up questions, which, despite our piloting efforts, were not consistently applied by interviewers.
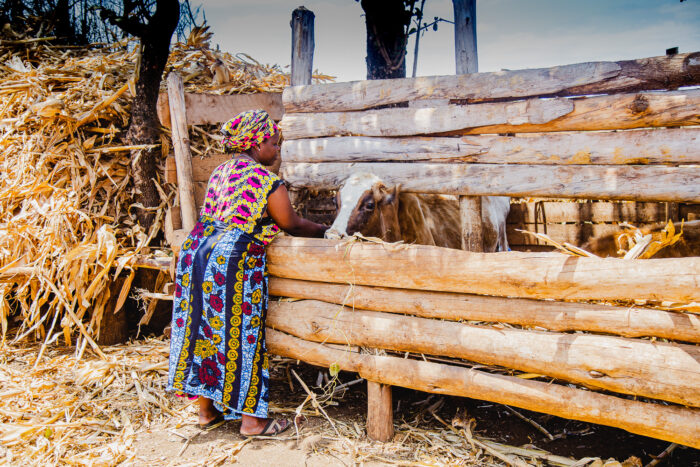 Photo from Dorcas’ Integrated Farm Planning project
We have learned from these experiences and are committed to improving our approach by dedicating more time to practice and reviewing the piloting process for QuIP questionnaires. It initially took more than 45 min per questionnaire but with experience, data collectors continued to improve and reduce the time take to collect data per questionnaire. Using recordings allowed the interview process to be more of a conversation rather than question and answer session.
Data analysis – causal mapping
Our journey with QuIP also introduced us to Causal Map, an innovative app that has simplified data import and coding processes. We initially used Excel and Microstrategy software, but transitioned to the Causal Map app, which has proven to be a game-changer. With its user-friendly interface and versatile analytical capabilities, Causal Map enables us to examine data from various angles and visualise causal chains in an appealing and informative manner with easy interpretation of causal factors.
Example findings
[From an anonymised study] The evaluation consisted of both a quantitative survey and qualitative interviews (using QuIP approach). The quantitative survey showed positive changes amongst participants like purpose, autonomy, household support and village support, as well as positive changes in aspects of resilience including income diversity, crop diversity, livestock and household resilience. The causal qualitative data collected indicated that training by Dorcas contributed to similar positive changes (as shown in the map below). For example, Dorcas training led to increased knowledge in particular hygiene and sanitation practices; increased knowledge contributed to better practices, and eventually to outcomes like improved health, increased agricultural production, increased quality and quantity of food, more money to spend and increased food consumption.
Figure 1: Increased knowledge
Causal map from QuIP data showing most frequent links to and from factors containing ‘Increased knowledge’
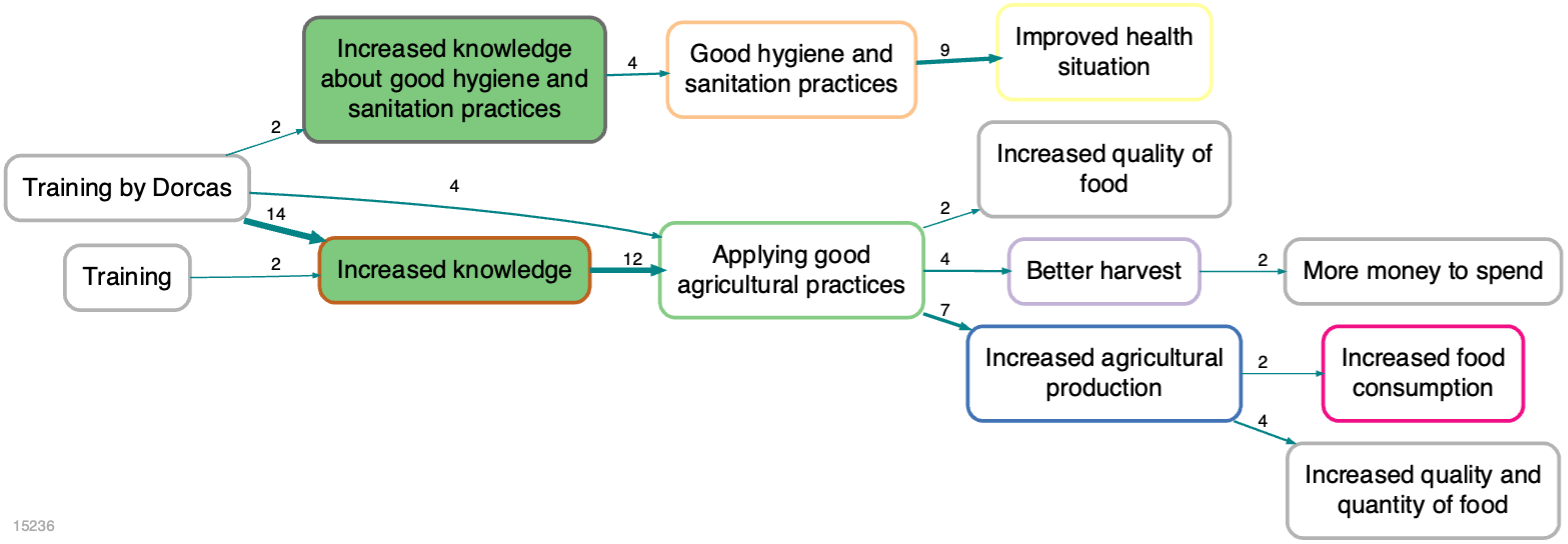
Using the causal maps we could understand the cause of the changes shown in the quantitative survey analysis and how these factors interacted. They indicated that Dorcas may have contributed to an increase in income diversity and crop diversity (more money to spend, increased agricultural production), the improved score on health and food (increased food consumption) and skills and knowledge (increased knowledge) as part of household resilience.
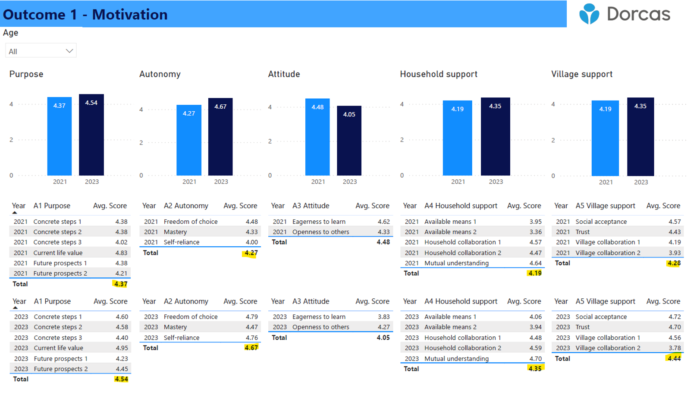
Figure 2: Outcome 1 – Motivation
Chart created from the quantitative survey
Conclusion
Dorcas’ adoption of QuIP has strengthened our commitment to impactful program evaluations and evidence-based decision-making. We have gained profound insights into our projects, identified causal factors driving outcomes, and embraced the power of causal mapping for data analysis and visualisation. As an NGO dedicated to positive change, we continue to refine our approach, recognising that our journey with QuIP has just begun. We are eager to explore new horizons, push boundaries, and maximise our impact on the communities we serve.


Comments are closed here.